Sonic Barrier Damping Material For SDA SRS 1.2TL Crossover

DarqueKnight
Posts: 6,765
Introduction
The custom crossover design for my SDA SRS 1.2TL loudspeakers incorporated several vibration abatements such as a bracing lower back plane, Dynamat Xtreme vibration damping material between the back plane and metal cover plate and all inductors and capacitors mounted on foam tape and secured with cable ties. I had considered completely covering the bracing plane with a vibration damping material such as Dynamat and/or placing some type of vibration damping material in the space between the two boards, but had not found a suitable material. I was hesitant to use Dynamat in that application because it is difficult to remove. Larry (TOOLFORLIFEFAN) suggested placing Sonic Barrier acoustic foam in that space. Sonic Barrier is made by Dayton Audio and sold by Parts Express. An 18" x 24" x 3/4" sheet cost $26.41, inclusive of shipping. This description is from the Parts Express website:
"The Sonic Barrier 3/4" 3-layer composite damping material is a premium acoustic absorption and barrier material. It uses the three layers to achieve excellent reduction of sound energy from the inside of the enclosure to the cabinet walls. An exclusive embossed surface finish helps to trap the acoustic energy into a 1/2" acoustic foam where it is converted to low-level heat. A 1/4" foam layer covered with 1/2 lb. limp copolymer vinyl barrier separates the absorptive layer from the cabinet walls. A very aggressive pressure sensitive adhesive provides easy and permanent installation onto any surface."
I did not peel off the adhesive's paper backing because I wanted to have the option of easy removal.
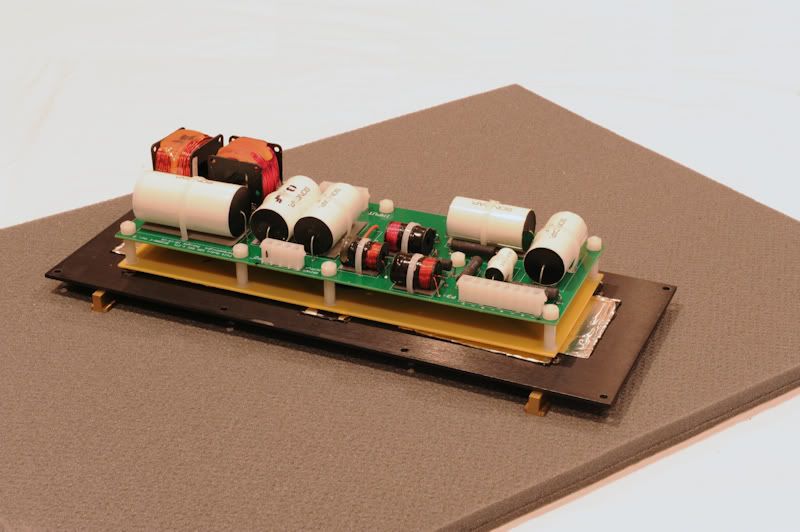
Figure 1. A 18" x 24" x 3/4" sheet of Sonic Barrier was enough to cut four damping pads for my SDA SRS 1.2TL and SDA SRS
crossovers.
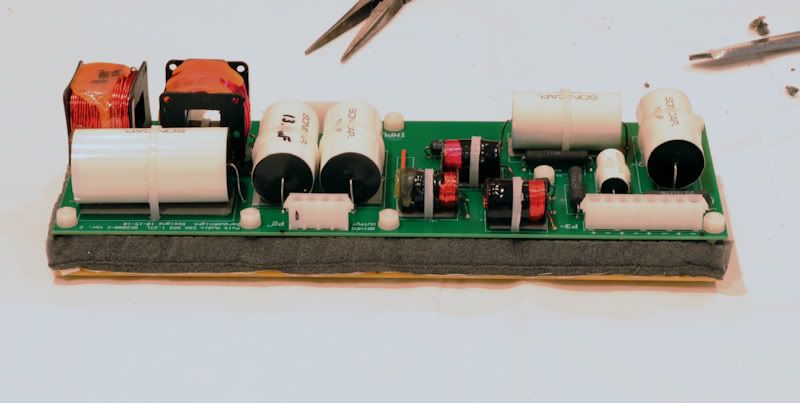
Figure 2. Sonic Barrier Sandwich.
Modification Procedure
Electrical and acoustic measurements of both speakers were taken prior to modification. Next, several music selections were played during which the sound stage was mapped and sound characteristics were noted. A Sonic Barrier damping pad was installed in the right speaker's crossover and measurements were recorded. That was followed by a listening session. A Sonic Barrier damping pad was installed in the left speaker's crossover and a final listening session was done. That was followed by measurements of the left speaker.
Measurements
Frequency spectrum (Fast Fourier Transform) measurements were taken with a Tektronix model 2012 oscilloscope at the speaker outputs. The test signals were 30 Hz and 1 kHz tones from the Autosound 2000 #101 Test CD. Frequency response, harmonic distortion and bass decay measurements were taken with Dayton Audio's OmniMic system.
Figures 3 through 10 show the frequency spectrum plots for 30 Hz and 1 kHz test tones for the modified and unmodified right and left speakers. Each horizontal tick mark represents 10 Hz of frequency. Each vertical tick mark represents 2 dB of amplitude. A summary of all oscilloscope measurements is given in table 1.
The addition of Sonic Barrier produced an average 3.5 dB reduction in the 30 Hz tone's third harmonic (90 Hz) and an average 2 dB reduction in the 1 kHz tone's third harmonic (3 kHz).
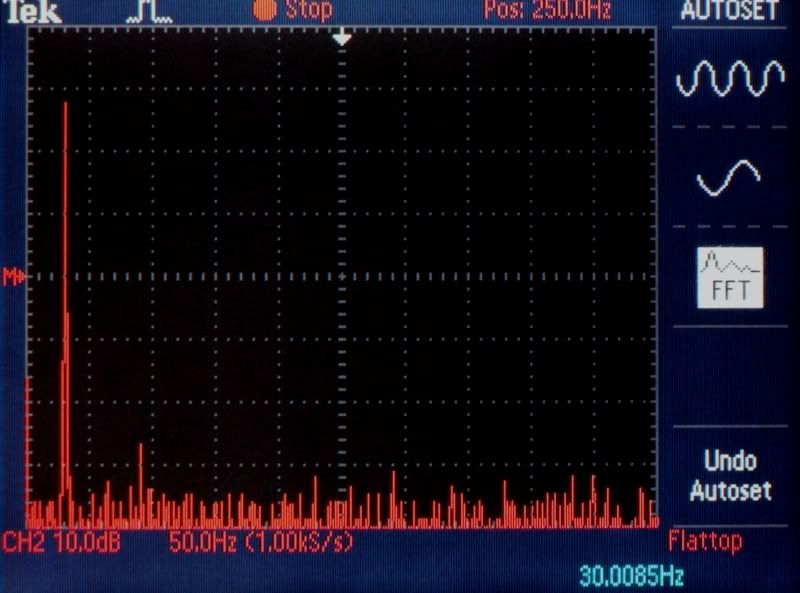
Figure 3. FFT plot of unmodified right speaker output with 30 Hz test tone.
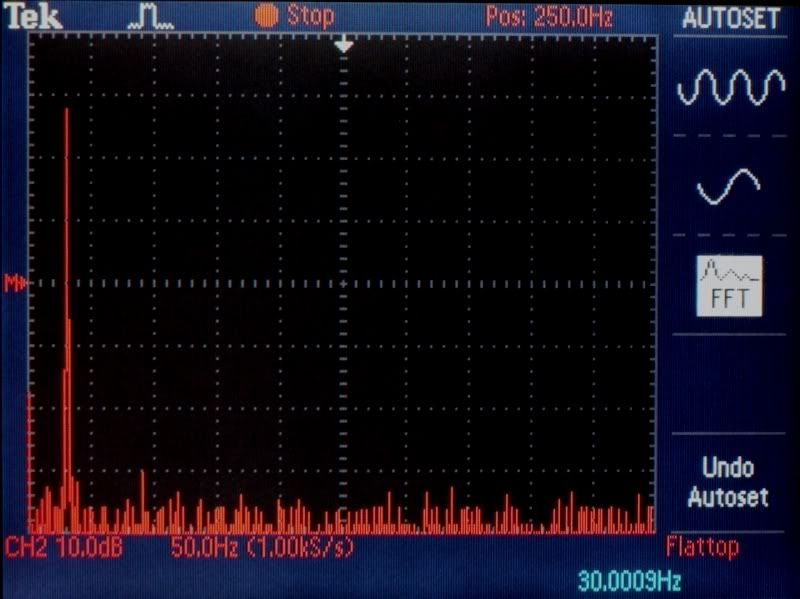
Figure 4. FFT plot of modified right speaker output with 30 Hz test tone.
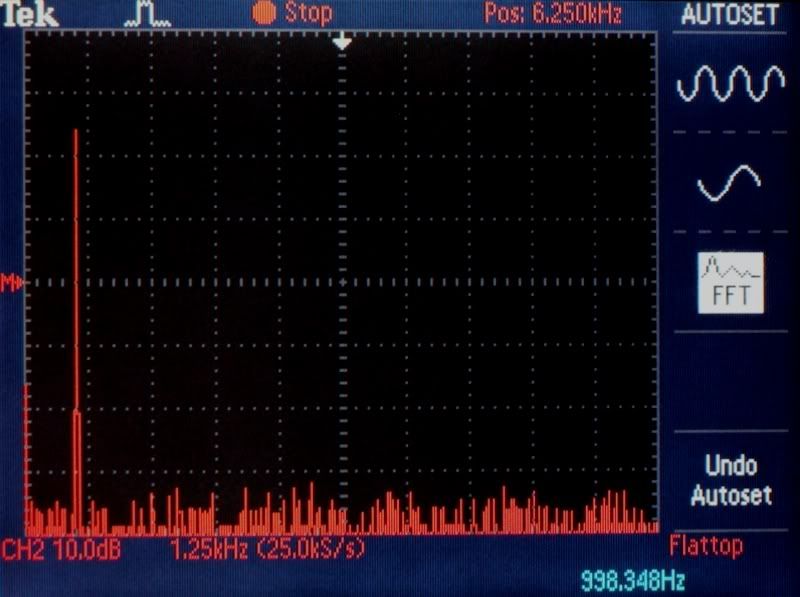
Figure 5. FFT plot of unmodified right speaker output with 1 kHz test tone.
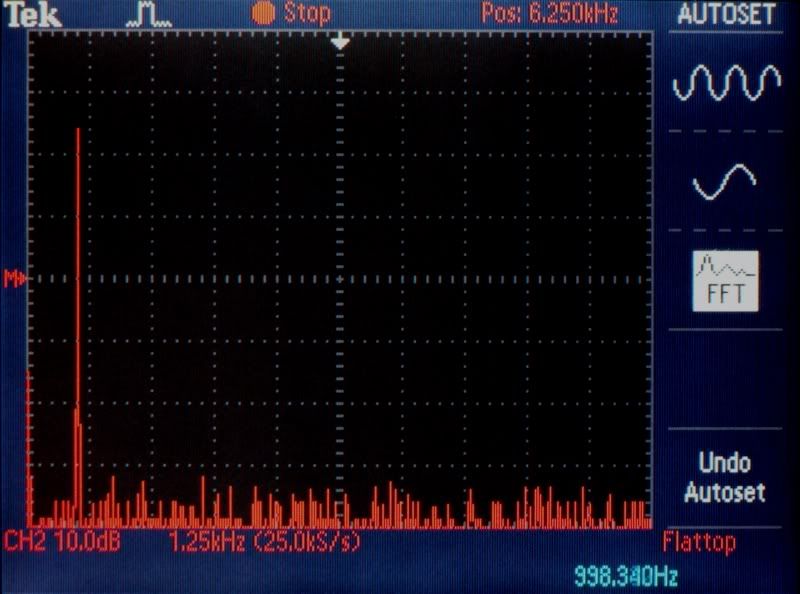
Figure 6. FFT plot of modified right speaker output with 1 kHz test tone.
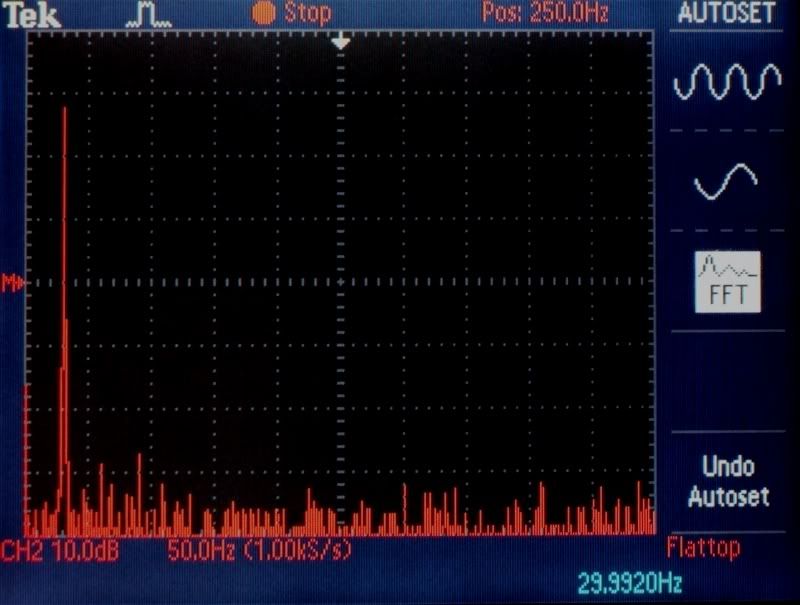
Figure 7. FFT plot of unmodified left speaker output with 30 Hz test tone.

Figure 8. FFT plot of modified left speaker output with 30 Hz test tone.
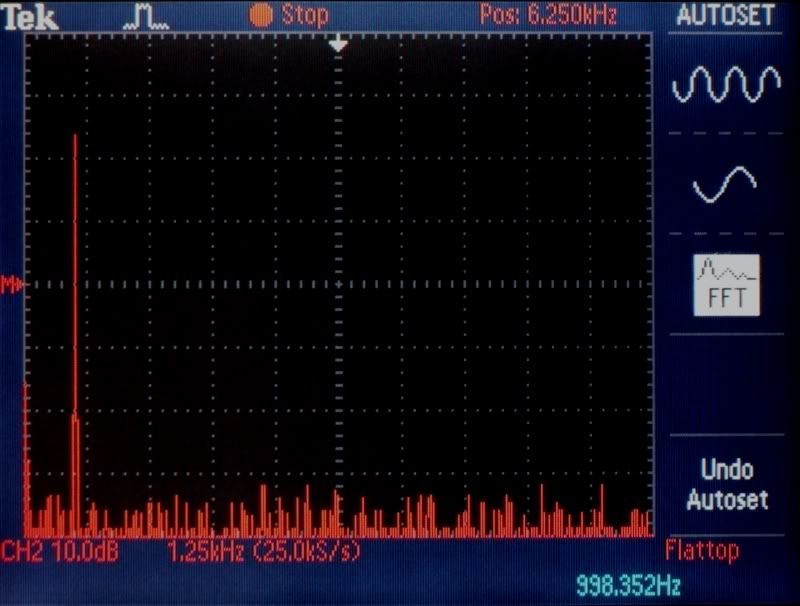
Figure 9. FFT plot of unmodified left speaker output with 1 kHz test tone.
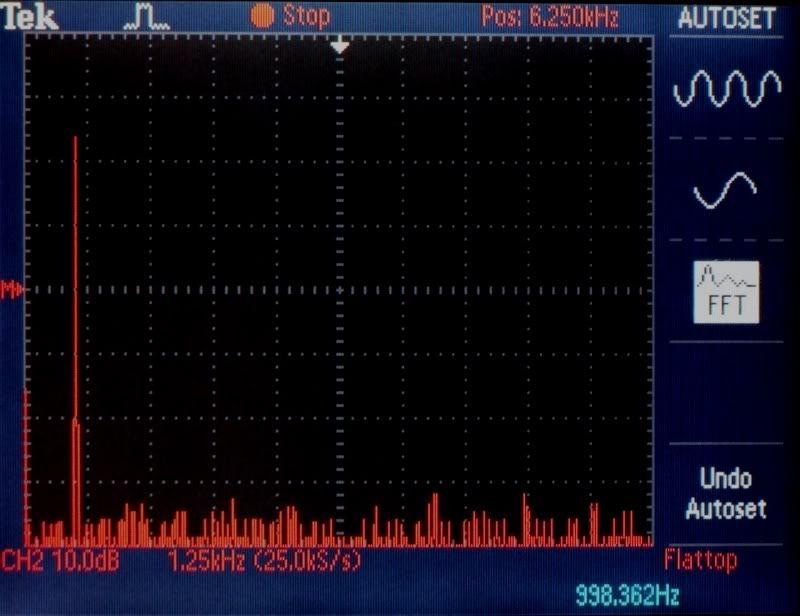
Figure 10. FFT plot of modified left speaker output with 1 kHz test tone.
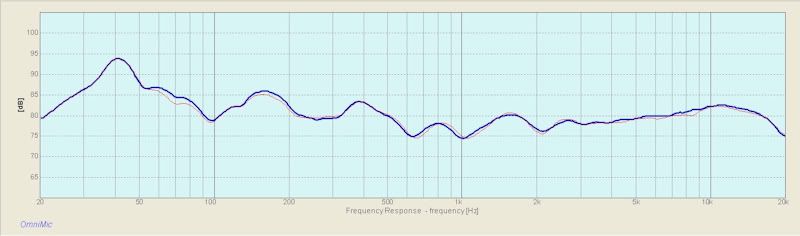
Figure 11. SDA SRS 1.2TL room response prior to Sonic Barrier addition (red line) and after.
The color coded lines in the harmonic distortion plots represent the following:
Black - frequency response.
Dark blue - sum of 2nd-5th harmonics.
Red - 2nd harmonic.
Purple - 3rd harmonic.
Green - 4th harmonic.
Light blue - 5th harmonic.
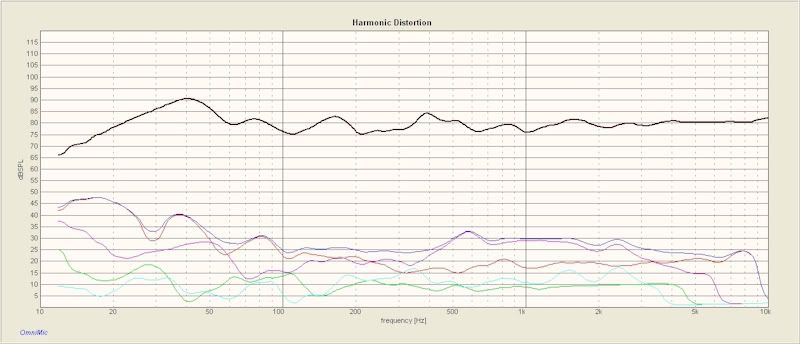
Figure 12. SDA SRS 1.2TL harmonic distortion prior to Sonic Barrier addition.
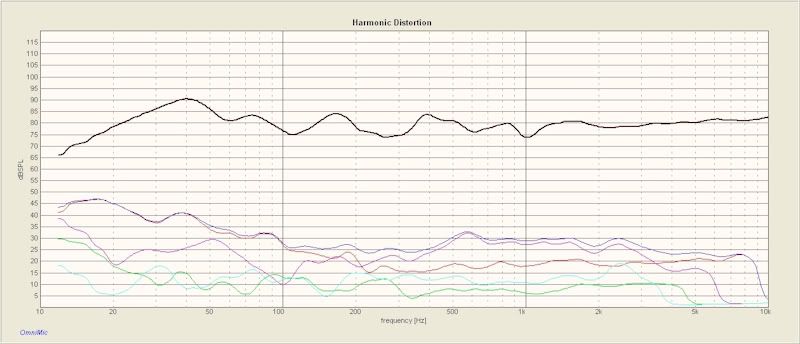
Figure 13. SDA SRS 1.2TL harmonic distortion after Sonic Barrier addition.
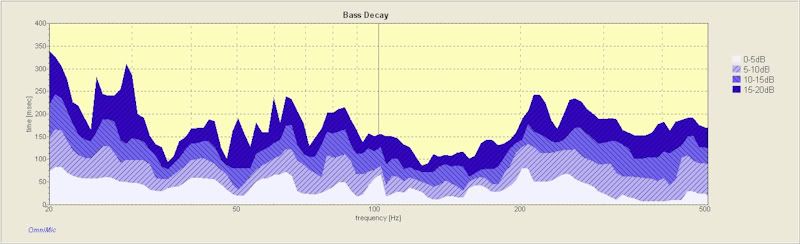
Figure 14. SDA SRS 1.2TL bass decay prior to Sonic Barrier addition.
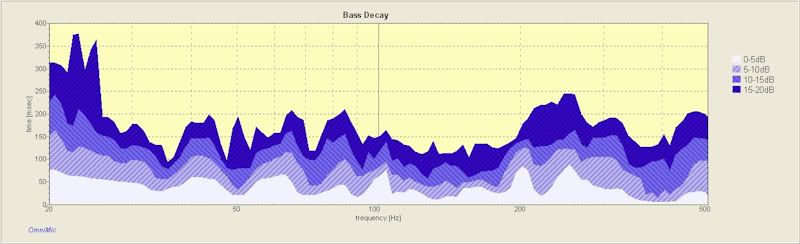
Figure 15. SDA SRS 1.2TL bass decay after Sonic Barrier addition.
Discussion of Measurement Results
The measurement results are remarkable considering all that was done was the installation of a 4" x 12" x 3/4" piece of acoustic foam between the crossover circuit boards. The FFT plots (figures 3-10) show a consistent reduction in the dissonant 3rd harmonics of the 30 Hz and 1 kHz test tones. The frequency response (room response) plot (figure 11) shows a slightly elevated response from 55-90 Hz, 150-200 Hz and 650-750 Hz. The harmonic distortion plots (figures 12 and 13) generally corroborate the FFT measurements. After the installation of the Sonic Barrier, there was more linearity in the 2nd harmonic from 25-100 Hz, more linearity in the 4th harmonic from 30-200 Hz and more linearity in the 5th harmonic from 40-3000 kHz. Harmonic linearity contributes to flatter response (and higher accuracy) as seen in the frequency response plot from 210-320 Hz and from 2 kHz-10 kHz.
The lower 3 dB limit of the SDA SRS 1.2TL is 27 Hz. The bass decay plots show an overall slightly smoother and lower amplitude bass decay characteristic from 30-200 Hz. The wide double-spiked area of decay times centered about the 27 Hz lower 3 dB point narrowed and re-centered at 24 Hz after Sonic Barrier installation.
From the OmniMic's instructions regarding bass decay measurements:
"When a bass note is stopped within music, the sound in the room at some frequencies may still continue for some time. That is because the sound reflects back and forth between walls, resonating and forming "modes" before eventually dying down. This is not altogether bad and some reinforcement is normally desirable for natural sounding playback, but you would like to keep it under control and not have some notes sounding muddy or lingering much longer than others.
The bass decay graph shows how long it takes the sound to decay at each frequency. As shown on the legend to the right of the decay graph, the white area extends upward to indicate when the level drops no more than 5 decibels (dB). The light blue indicates when the level has dropped between 5dB and 10dB, etc."
In their stock form, the SDA SRS 1.2TL already exhibited very low bass distortion. The addition of damping material to the stabilized crossover assembly, plus steel driver retaining rings and wall bracing further enhanced the production of Such Good Sound!
References
1. Improvements To Modified SDA SRS 1.2TL Crossover
2. SDA SRS 1.2TL Bass Brace Pt. 1
3. SDA SRS 1.2TL Bass Brace Pt. 2
The custom crossover design for my SDA SRS 1.2TL loudspeakers incorporated several vibration abatements such as a bracing lower back plane, Dynamat Xtreme vibration damping material between the back plane and metal cover plate and all inductors and capacitors mounted on foam tape and secured with cable ties. I had considered completely covering the bracing plane with a vibration damping material such as Dynamat and/or placing some type of vibration damping material in the space between the two boards, but had not found a suitable material. I was hesitant to use Dynamat in that application because it is difficult to remove. Larry (TOOLFORLIFEFAN) suggested placing Sonic Barrier acoustic foam in that space. Sonic Barrier is made by Dayton Audio and sold by Parts Express. An 18" x 24" x 3/4" sheet cost $26.41, inclusive of shipping. This description is from the Parts Express website:
"The Sonic Barrier 3/4" 3-layer composite damping material is a premium acoustic absorption and barrier material. It uses the three layers to achieve excellent reduction of sound energy from the inside of the enclosure to the cabinet walls. An exclusive embossed surface finish helps to trap the acoustic energy into a 1/2" acoustic foam where it is converted to low-level heat. A 1/4" foam layer covered with 1/2 lb. limp copolymer vinyl barrier separates the absorptive layer from the cabinet walls. A very aggressive pressure sensitive adhesive provides easy and permanent installation onto any surface."
I did not peel off the adhesive's paper backing because I wanted to have the option of easy removal.
Figure 1. A 18" x 24" x 3/4" sheet of Sonic Barrier was enough to cut four damping pads for my SDA SRS 1.2TL and SDA SRS
crossovers.
Figure 2. Sonic Barrier Sandwich.
Modification Procedure
Electrical and acoustic measurements of both speakers were taken prior to modification. Next, several music selections were played during which the sound stage was mapped and sound characteristics were noted. A Sonic Barrier damping pad was installed in the right speaker's crossover and measurements were recorded. That was followed by a listening session. A Sonic Barrier damping pad was installed in the left speaker's crossover and a final listening session was done. That was followed by measurements of the left speaker.
Measurements
Frequency spectrum (Fast Fourier Transform) measurements were taken with a Tektronix model 2012 oscilloscope at the speaker outputs. The test signals were 30 Hz and 1 kHz tones from the Autosound 2000 #101 Test CD. Frequency response, harmonic distortion and bass decay measurements were taken with Dayton Audio's OmniMic system.
Figures 3 through 10 show the frequency spectrum plots for 30 Hz and 1 kHz test tones for the modified and unmodified right and left speakers. Each horizontal tick mark represents 10 Hz of frequency. Each vertical tick mark represents 2 dB of amplitude. A summary of all oscilloscope measurements is given in table 1.
The addition of Sonic Barrier produced an average 3.5 dB reduction in the 30 Hz tone's third harmonic (90 Hz) and an average 2 dB reduction in the 1 kHz tone's third harmonic (3 kHz).
Figure 3. FFT plot of unmodified right speaker output with 30 Hz test tone.
Figure 4. FFT plot of modified right speaker output with 30 Hz test tone.
Figure 5. FFT plot of unmodified right speaker output with 1 kHz test tone.
Figure 6. FFT plot of modified right speaker output with 1 kHz test tone.
Figure 7. FFT plot of unmodified left speaker output with 30 Hz test tone.
Figure 8. FFT plot of modified left speaker output with 30 Hz test tone.
Figure 9. FFT plot of unmodified left speaker output with 1 kHz test tone.
Figure 10. FFT plot of modified left speaker output with 1 kHz test tone.
Table 1. Summary of 30 Hz and 1 kHz Test Signal Output Voltage Levels.
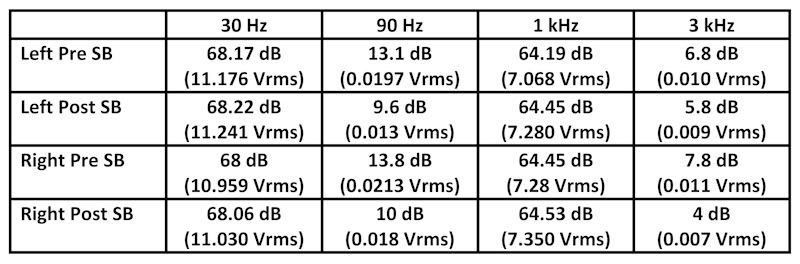
Figure 11. SDA SRS 1.2TL room response prior to Sonic Barrier addition (red line) and after.
The color coded lines in the harmonic distortion plots represent the following:
Black - frequency response.
Dark blue - sum of 2nd-5th harmonics.
Red - 2nd harmonic.
Purple - 3rd harmonic.
Green - 4th harmonic.
Light blue - 5th harmonic.
Figure 12. SDA SRS 1.2TL harmonic distortion prior to Sonic Barrier addition.
Figure 13. SDA SRS 1.2TL harmonic distortion after Sonic Barrier addition.
Figure 14. SDA SRS 1.2TL bass decay prior to Sonic Barrier addition.
Figure 15. SDA SRS 1.2TL bass decay after Sonic Barrier addition.
Discussion of Measurement Results
The measurement results are remarkable considering all that was done was the installation of a 4" x 12" x 3/4" piece of acoustic foam between the crossover circuit boards. The FFT plots (figures 3-10) show a consistent reduction in the dissonant 3rd harmonics of the 30 Hz and 1 kHz test tones. The frequency response (room response) plot (figure 11) shows a slightly elevated response from 55-90 Hz, 150-200 Hz and 650-750 Hz. The harmonic distortion plots (figures 12 and 13) generally corroborate the FFT measurements. After the installation of the Sonic Barrier, there was more linearity in the 2nd harmonic from 25-100 Hz, more linearity in the 4th harmonic from 30-200 Hz and more linearity in the 5th harmonic from 40-3000 kHz. Harmonic linearity contributes to flatter response (and higher accuracy) as seen in the frequency response plot from 210-320 Hz and from 2 kHz-10 kHz.
The lower 3 dB limit of the SDA SRS 1.2TL is 27 Hz. The bass decay plots show an overall slightly smoother and lower amplitude bass decay characteristic from 30-200 Hz. The wide double-spiked area of decay times centered about the 27 Hz lower 3 dB point narrowed and re-centered at 24 Hz after Sonic Barrier installation.
From the OmniMic's instructions regarding bass decay measurements:
"When a bass note is stopped within music, the sound in the room at some frequencies may still continue for some time. That is because the sound reflects back and forth between walls, resonating and forming "modes" before eventually dying down. This is not altogether bad and some reinforcement is normally desirable for natural sounding playback, but you would like to keep it under control and not have some notes sounding muddy or lingering much longer than others.
The bass decay graph shows how long it takes the sound to decay at each frequency. As shown on the legend to the right of the decay graph, the white area extends upward to indicate when the level drops no more than 5 decibels (dB). The light blue indicates when the level has dropped between 5dB and 10dB, etc."
In their stock form, the SDA SRS 1.2TL already exhibited very low bass distortion. The addition of damping material to the stabilized crossover assembly, plus steel driver retaining rings and wall bracing further enhanced the production of Such Good Sound!
References
1. Improvements To Modified SDA SRS 1.2TL Crossover
2. SDA SRS 1.2TL Bass Brace Pt. 1
3. SDA SRS 1.2TL Bass Brace Pt. 2
Proud and loyal citizen of the Digital Domain and Solid State Country!
Post edited by DarqueKnight on
Comments
-
Random Listening Notes
After installation of a Sonic Barrier pad in the right speaker's crossover, the first musical selection played was Dave Koz's "Just to be next to you" ("Saxophonic" CD). There was a very subtle increase in sound volume on the right side. The next song played was Sheila E's "Bahia" ("Heaven" CD). On that song, the right side was much clearer than the left. Koz's song was mixed with the instruments spread out in the space between the speakers. On Sheila E's song, most of the instruments were also concentrated in the center, but there was an identical background vocal track that came from each speaker. On the right side, the vocals came from a position further in front of, and higher up, than the left side. The vocals were also clearer and a little louder on the right side.
After the left speaker was modified, there were additional small improvements in bass articulation and detail in the center and a small improvement in vocal clarity in the center.
On some recordings, there was more depth and three dimensionality. For example, on the orchestral instrumental "Love's Theme" ("Barry White All-Time Greatest Hits" CD), the opening violin section's flourishes clearly and distinctly started in front of the right speaker and moved section by section to the left ending just left of the center point between the speakers. Not only did I hear the sound move from right to left, but also slightly backward as it progressed to the left. The sound gave the sensation of thick, sharply defined swirls of sound moving from right to left toward the rear of the sound stage. I also noticed for the first time that the electric guitar player positioned to the far upper right of the violins sometimes seemed to be slightly out of time with the rest of the orchestra. This song is also included on the "Best of Our Love" double LP by the Love Unlimited orchestra. Recording quality on the LP varies from track to track. The "Love's Theme" track is horrible with compressed sound stage and compressed dynamics. Also, the channels are reversed from the version on the CD.Proud and loyal citizen of the Digital Domain and Solid State Country! -
Another member here recently did something similar, he also had positive results.
This is why I prefer external crossovers, to remove the passive components from the speaker cabinet's resonances. Potted components such as Claritycap MR, ESA, and Duelund CAST would be an even further improvement."He who fights with monsters should look to it that he himself does not become a monster. And when you gaze long into an abyss the abyss also gazes into you." Friedrich Nietzsche -
This is why I prefer external crossovers, to remove the passive components from the speaker cabinet's resonances. Potted components such as Claritycap MR, ESA, and Duelund CAST would be an even further improvement.
Both of those are on my list of things to do in the future...when I'm more dedicated to audio than I am now. Proud and loyal citizen of the Digital Domain and Solid State Country!
 -
I am already working on that but this is nothing you don't already know..

Thanks for the write up Ray I figured you would like it..Another member here recently did something similar, he also had positive results.
This is why I prefer external crossovers, to remove the passive components from the speaker cabinet's resonances. Potted components such as Claritycap MR, ESA, and Duelund CAST would be an even further improvement.

